Importance US life expectancy has not kept pace with that of other wealthy countries and is now decreasing.
Objective To examine vital statistics and review the history of changes in US life expectancy and increasing mortality rates; and to identify potential contributing factors, drawing insights from current literature and an analysis of state-level trends.
Evidence Life expectancy data for 1959-2016 and cause-specific mortality rates for 1999-2017 were obtained from the US Mortality Database and CDC WONDER, respectively. The analysis focused on midlife deaths (ages 25-64 years), stratified by sex, race/ethnicity, socioeconomic status, and geography (including the 50 states). Published research from January 1990 through August 2019 that examined relevant mortality trends and potential contributory factors was examined.
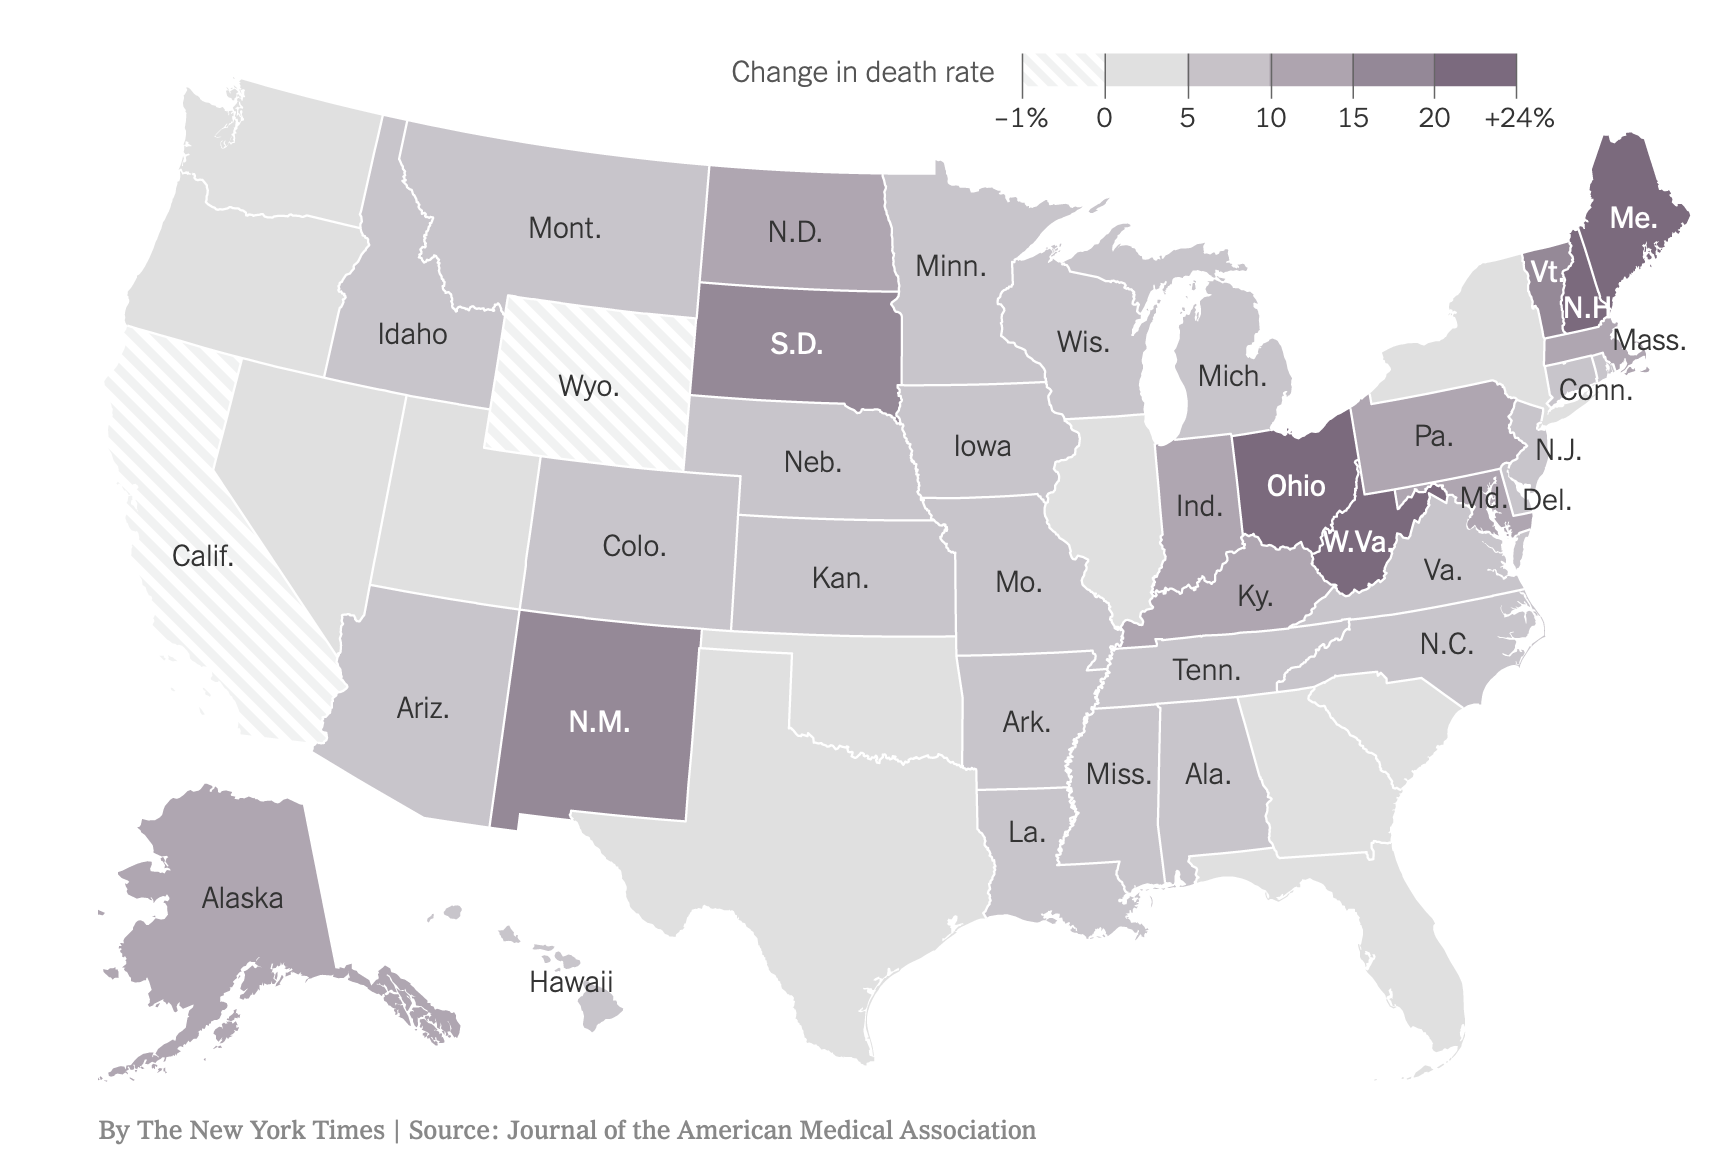
Findings Between 1959 and 2016, US life expectancy increased from 69.9 years to 78.9 years but declined for 3 consecutive years after 2014. The recent decrease in US life expectancy culminated a period of increasing cause-specific mortality among adults aged 25 to 64 years that began in the 1990s, ultimately producing an increase in all-cause mortality that began in 2010. During 2010-2017, midlife all-cause mortality rates increased from 328.5 deaths/100 000 to 348.2 deaths/100 000. By 2014, midlife mortality was increasing across all racial groups, caused by drug overdoses, alcohol abuse, suicides, and a diverse list of organ system diseases. The largest relative increases in midlife mortality rates occurred in New England (New Hampshire, 23.3%; Maine, 20.7%; Vermont, 19.9%) and the Ohio Valley (West Virginia, 23.0%; Ohio, 21.6%; Indiana, 14.8%; Kentucky, 14.7%). The increase in midlife mortality during 2010-2017 was associated with an estimated 33 307 excess US deaths, 32.8% of which occurred in 4 Ohio Valley states.
Conclusions and Relevance US life expectancy increased for most of the past 60 years, but the rate of increase slowed over time and life expectancy decreased after 2014. A major contributor has been an increase in mortality from specific causes (eg, drug overdoses, suicides, organ system diseases) among young and middle-aged adults of all racial groups, with an onset as early as the 1990s and with the largest relative increases occurring in the Ohio Valley and New England. The implications for public health and the economy are substantial, making it vital to understand the underlying causes.
The JAMA paper was front-page news in the New York Times November 27. Excerpts from the story by Gina Kolata and Sabrina Tavernise follow:
“‘The whole country is at a health disadvantage compared to other wealthy nations,’” the study’s lead author, Dr. Steven Woolf of Virginia Commonwealth University, said. “’We are losing people in the most productive period of their lives. Children are losing parents. Employers have a sicker work force.’
“A new analysis of more than a half-century of federal mortality data, published on Tuesday in JAMA, found that the increased death rates among people in midlife extended to all racial and ethnic groups, and to suburbs and cities. And while suicides, drug overdoses and alcoholism were the main causes, other medical conditions, including heart disease, strokes and chronic obstructive pulmonary disease, also contributed, the authors reported.
“Death rates are actually improving among children and older Americans, Dr. Woolf noted, perhaps because they may have more reliable health care — Medicaid for many children and Medicare for older people.
“According to the new study, the death rate from 2010 to 2017 for all causes among people ages 25 to 64 increased from 328.5 deaths per 100,000 people to 348.2 deaths per 100,000. It was clear statistically by 2014 that it was not just whites who were affected, but all racial and ethnic groups and that the main causes were drug overdoses, alcohol and suicides.
“The states with the greatest relative increases in death rates among young and middle-aged adults were New Hampshire, Maine, Vermont, West Virginia and Ohio.
“Dr. Woolf said one of the findings showed that the excess deaths were highly concentrated geographically, with fully a third of them in just four states: Ohio, Pennsylvania, Kentucky and Indiana.
“‘What’s not lost on us is what is going on in those states,’ he said. ‘The history of when this health trend started happens to coincide with when these economic shifts began — the loss of manufacturing jobs and closure of steel mills and auto plants.’