Part 1: On Genghis Khan, Racing Trophies, and USMLE Score Creep by Brian Carmody, MD
Genghis Khan was the leader of the Mongol Empire.
At its largest, his army numbered around 130,000 soldiers, consisting primarily of a well-trained cavalry.
The Mongol soldiers were well equipped. They carried bows that could fire an arrow 250 meters – twice as far as an English longbow – and their archers could shoot up to 6 arrows a minute. Their cavalrymen carried scimitars made of bulat steel; strapped daggers to their left hands for fighting in close quarters; and both the horse and rider were protected in a leather armor that had been hardened by soaking in urine.
The Mongol army was both fierce and feared. By his death in 1227, Genghis Khan presided over territory extending from the Pacific Ocean to the Caspian Sea.
THIS IS A PICTURE OF SOLDIERS FROM THE MODERN MONGOLIAN ARMED FORCES.

Today, the Mongolian Armed Forces exists primarily for border security and self-defense.
The army consists of around 35,000 active personnel, and runs off of a budget of just $70 million per year. But, they have 470 tanks, 700 artillery, a small Air Force with some Soviet-era planes and helicopters, and – somewhat curiously for a landlocked country – a naval force consisting of 7 men (though only one of them knows how to swim).
As armed forces go, it’s hardly the strongest in the world. According to a website that ranks such things, the Mongolian Armed Forces were the 105th most powerful army in the world in 2020.
But…
Suppose we brought Genghis Khan’s Golden Horde into the present day, and had them square off against the modern Mongolian army. Who would win?
Genghis Khan conquered much of the world with his army, creating the single largest land empire that history has ever known. And yet, if his army met the Mongolian Armed Forces on the field of battle today, there is little doubt that the latter would emerge as the victor.
Military strength is relative. To win a war, you don’t have to have the best army in the world. You just have to have a better army than your opponent.
–
THIS IS A TROPHY ON A SHELF IN MY HOUSE.

THE REASON MY TROPHY IS SHAPED LIKE A SHEEP IS EXPLAINED HERE.
Believe it or not, this is actually a trophy for winning first place in my age group in a half-marathon.
Are you impressed? Betcha didn’t know I was such a good runner, huh!
Well, here’s the thing…
The fact that I have this trophy tells you next-to-nothing about how good of a runner I am.
For all you know, I could be a former Olympian. Or, I could have the athletic prowess of the average dad you see plodding flat-footed and red-faced around your neighborhood on his weekend jog.
(Hint: go with the latter.)
To earn this trophy, I didn’t have to maintain a certain pace, or finish in a certain time. All had to do was run a little faster than the other runners who turned up that day.
But if you’re really interested in assessing my running ability, you probably aren’t interested in my relative performance. You’d want to know my time. You’d want to know what I can do in absolute terms.
–
THIS IS THE CURRENT DISTRIBUTION OF SCORES FOR THE USMLE STEP 1 EXAM.
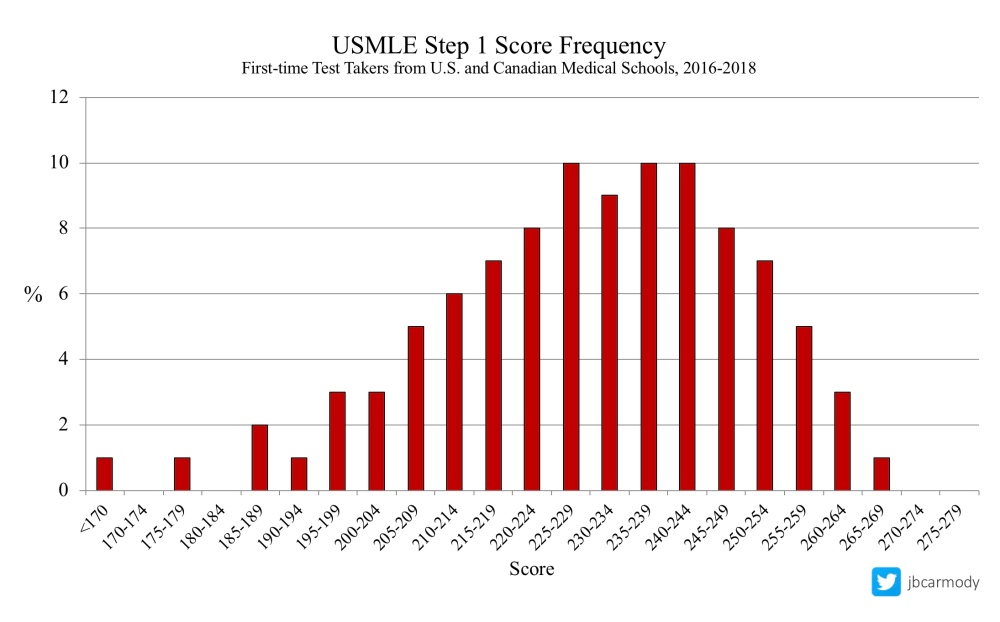
I sometimes hear medical students describe a Step 1 score of 250+ as being “the golden ticket.” A 250 puts you in around the top 15% of all first-time test-takers from U.S. medical schools – and opens the door to the most competitive specialties, like dermatology, orthopedics, otolaryngology, interventional radiology, and neurosurgery (each of which currently has a mean Step 1 score in the high 240s for successful applicants).
Of course, the distribution above was made with contemporary data. In 2018, the mean USMLE score for U.S. students was 230, with a standard deviation of 19.
But the score distribution didn’t always look like this.
–
THIS IS A DESCRIPTION OF THE ORIGINAL USMLE STEP 1 EXAM.

When the USMLE began in 1992, raw scores were scaled to a new three-digit scale with a mean of 200 and a standard deviation of 20.
If you wanted to have a score that put you in the top ~15% of test-takers – and get the same “golden ticket” as those with a 250 today – all you needed was a score of 219.
You read that right.
Nowadays, if you try to get into a highly competitive specialty with a score of 219, good luck. According to the NRMP’s Charting Outcomes report, know how many U.S. students matched into neurosurgery with a Step 1 score <220 in 2018? Eight.
Otolaryngology? Eight.
Dermatology? Seven.
Plastic surgery? One.
Interventional radiology? A big fat zero.
But here’s the thing: the USMLE has never undergone a “recentering” like the SAT. A test-taker who answers a given percentage of items correctly would receive precisely the same three-digit score today that they would have received for such a performance 25 years ago.
In other words, in terms of their absolute performance, a student with a 219 today has exactly the same basic science knowledge as the student with a 219 from 1993. It’s only their performance relative to their peers that differs.
But as you can see below, that difference can be striking.
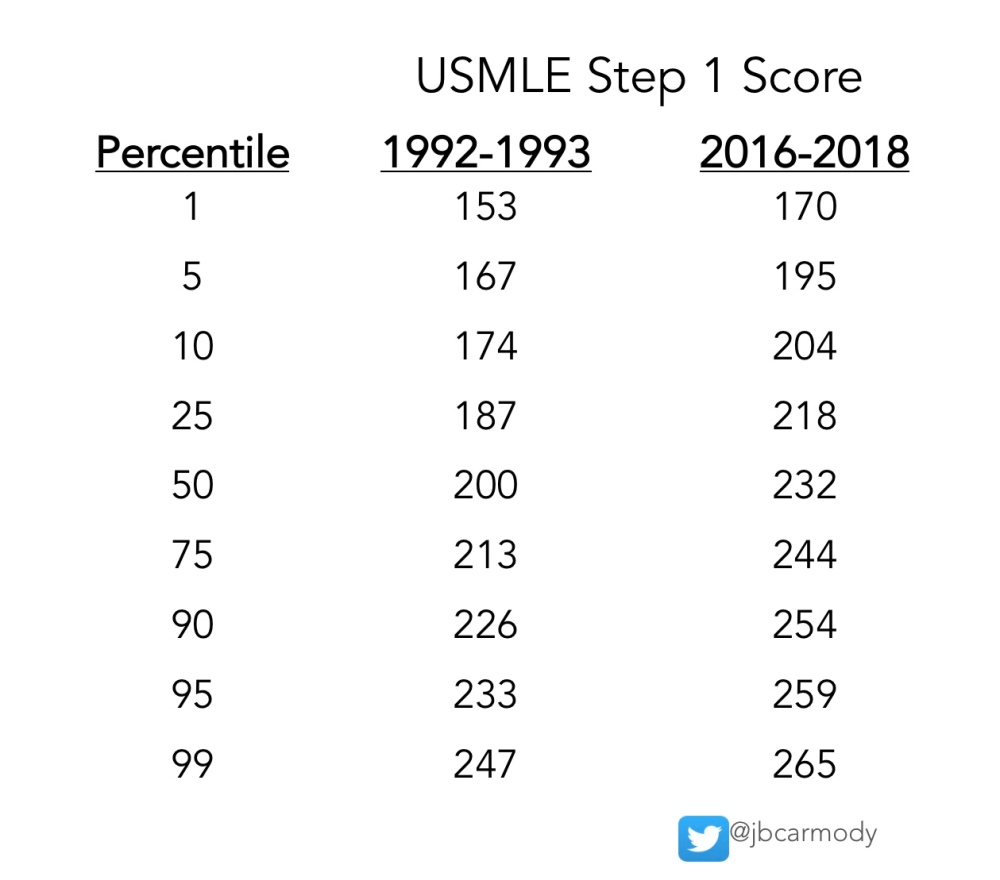
USMLE STEP 1 SCORES AND PERCENTILES, THEN AND NOW.
For Step 2 CK scores, the shift in scores is even more dramatic. An examinee who hits the today’s median score (244) would have lived like a king in 1992, with a Step 2 score that would have been better than the 95th percentile.

USMLE STEP 2 (CK) SCORES AND PERCENTILES, THEN AND NOW.
Put another way, our most prestigious specialties are filled with physicians whose medical knowledge entering residency – as measured by their USMLE scores – would be considered inadequate by many programs in those same disciplines today. And yet, somehow these physicians have gone on to be gainfully employed, provide capable medical care, and contribute to the body of knowledge in their fields. Some of them undoubtedly serve as program directors and department chairs today.
The fact that we’ve trained a generation of successful physicians with USMLE scores 20-30 points lower than those applying today should be prima facie evidence that absolute knowledge above a certain threshold is sufficient to successfully train and practice even in the most competitive specialties.
So what is it that we really care about in residency selection? Absolute – or relative – performance?
–
THIS IS USMLE STEP 1 SCORE CREEP.
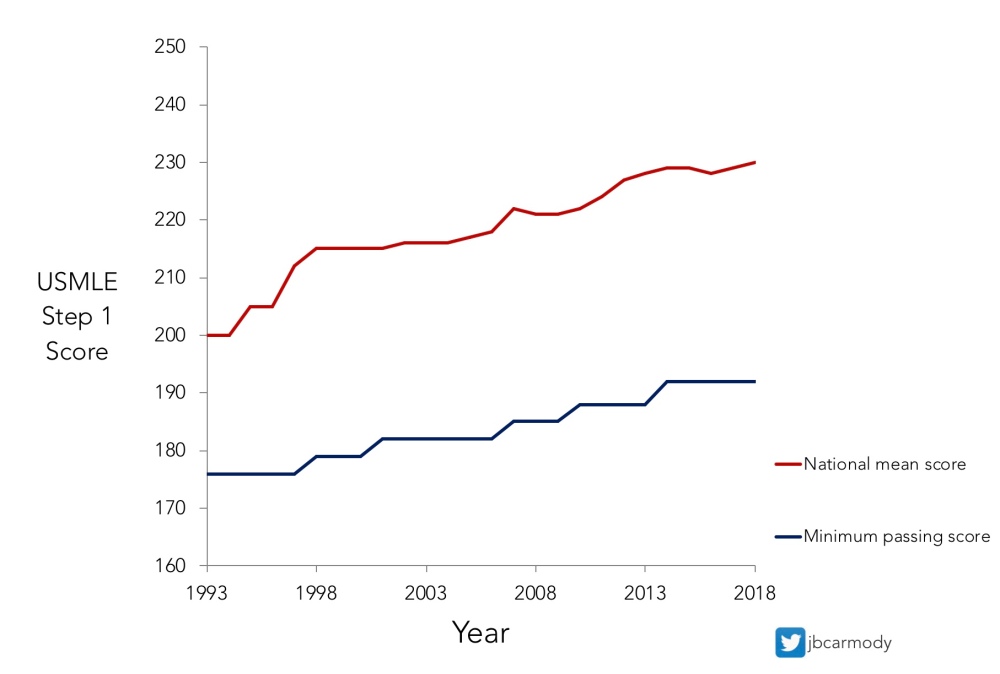
This is also the part of the story where I listeners interrupt to claim that the rise in scores is just due to contemporary study resources. “B-b-but what about UFAPS! That’s why scores today are higher! Twenty years ago, they didn’t have UWorld/First Aid/Anki/Pathoma/Sketchy!”
Yes, it’s true that today’s test-prep resources more efficiently prepare their users for a multiple-choice examination than the textbooks of days past. And that definitely helps. But in isolation, better resources are insufficient to explain the rise in scores.
Let me explain why with an example.
In 1908, the first washing machine was invented. That was nice, because washing clothes by hand was a time-consuming and tedious task.
So what do you suppose happened next?
People spent less time washing their clothes.
Know what didn’t happen?
People working day and night, frantically washing their clothes over and over to make sure they had the very cleanest clothes in the neighborhood.
Are today’s study resources better? Sure.
But if there wasn’t value in scoring higher and higher, today’s students would just study less, get the same scores as they did 25 years ago, and have a heck of a lot more time to binge-watch Netflix and compulsively update their Instagram.
THE RESIDENCY SELECTION ARMS RACE
Of course, it’s not just USMLE scores that are rising. Every other quantifiable portion of the application has been increasing, too. Applicants today report more research, list more community service activities, and complete more “audition” rotations than applicants did even just a few years ago.
Fun fact: the average unmatched applicant in dermatology in 2018 reported more research items (8.6) than the average matched applicant did in 2007 (5.7). Of course, a paltry 8.6 research items doesn’t get you too far when the average successful dermatology applicant these days proudly lists 14.7 research abstracts, presentations, and manuscripts.
And if you think the growth in research output is limited only to applicants in competitive specialties, think again. The same is true for internal medicine. Today’s successful IM applicant now reports a mean of 5.1 research items. But even applicants who went unmatched in 2018 still had more research items (2.9) than successful applicants from a decade ago (2.2). It’s not how much you’ve got – it’s whether you’ve got more of it than your competition.
Put simply, residency selection is a competition in which relative accompishment is king. It’s Genghis Khan conquering the world, rather than the modern Mongolian Armed Forces conquering him. It’s collecting race trophies without considering the times that earned them. It’s an arms race. And it has no natural end.
If all we ask for is more, more, MORE from our applicants, they’ll give it to us. But is that really what we want? How can we end the residency selection arms race while still encouraging excellence?
Hard questions, I know… and if you want my thoughts, come back soon for Part 2.